Data Without a Decision Framework Is Just Noise
GoHighLevel generates an enormous volume of data continuously — every form submission, email open, SMS reply, calendar booking, pipeline stage change, payment processed, automation triggered, and Google review received is logged with a precise timestamp. Businesses that grow consistently are not those with the most data. They are those who have agreed in advance on 8 to 10 specific numbers that predict revenue, review those numbers on a fixed schedule each week, and act within 48 hours when a metric moves in the wrong direction. This guide shows you how to build GoHighLevel reporting dashboards that give you exactly that clarity, how to use attribution reporting to make smarter marketing investments, and how to turn this data into client reports that retain clients at dramatically higher rates.
The most important step in any reporting setup happens before you open the GHL dashboard builder: defining your success metrics. For service businesses using GoHighLevel, eight KPIs together tell the complete revenue story. Cost Per Lead: total marketing spend divided by new contacts generated this period. Lead-to-Appointment Rate: the percentage of new leads who book a consultation or discovery call. Appointment-to-Close Rate: the percentage of consultations that convert to paying clients. Average Deal Value: the average revenue generated per new client won. Client Lifetime Value: the average total revenue per client across their full engagement period. Monthly Churn Rate: the percentage of active retainer clients who cancel in any given month. Email Deliverability Rate: the percentage of emails landing in the inbox rather than the spam folder. And Review Velocity: the number of new five-star Google reviews generated per month. Track all eight, compare each to the prior month, and set quarterly improvement targets for the two or three metrics that represent your current biggest growth constraint.
Building Your GoHighLevel Dashboard
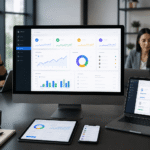
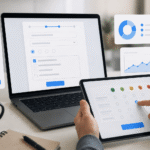
Navigate to Reporting → Dashboard in your GHL sub-account and click Add Widget. GHL provides pre-built widgets for every major data category. Contact Activity widgets display new contacts added this period, broken down by traffic source and tag, revealing which lead generation channels are most active. Pipeline widgets show total deal value by stage, deals advanced this period, and revenue won — giving a financial snapshot of your sales funnel at any moment. Appointment widgets break down bookings into confirmed, completed, cancelled, and no-show categories so you can calculate your no-show rate and track the impact of your reminder automation. Email Statistics widgets display send volume, open rate, click-through rate, and unsubscribe rate across all campaigns and individual sequences.
Conversation widgets aggregate total message volume across SMS, email, Facebook Messenger, Instagram DMs, and Google Business Profile messages in a unified view, showing response rates by channel. Revenue widgets display all payments processed through GHL’s integrated Stripe checkout. Ad Reporting widgets show Facebook and Google ad spend alongside leads generated and, when pipeline revenue is tracked, cost per acquisition — closing the attribution loop between marketing spend and revenue generated. Arrange your dashboard with the most business-critical widgets at the top, visible without scrolling. A lead generation focused service business should see New Contacts This Month, Appointments Booked, and Pipeline Revenue Won as the three top-row widgets. The second row should show Email Open Rate, SMS Response Rate, and Google Review Count. A third row with Revenue Collected and Cost Per Lead provides the financial context.
Attribution Reporting: The Truth About Which Channels Generate Revenue
Most marketing teams believe they know which channels drive results. Most are basing that belief on top-of-funnel lead volume rather than bottom-of-funnel revenue, which produces systematically wrong conclusions. A Facebook campaign generating 100 leads at $10 per lead appears twice as productive as a Google search campaign generating 40 leads at $25 per lead. Until you track close rates: the Facebook leads close at 4 percent producing 4 clients at $250 cost per acquisition, while the Google leads close at 25 percent producing 10 clients at $100 cost per acquisition. Full-funnel attribution reveals the Google campaign is 2.5 times more efficient despite its higher cost per lead.
Configure GHL attribution by tagging every contact with their traffic source at the moment of capture using UTM parameters on all campaign URLs. Create UTM source, medium, and campaign tags for every paid and organic channel. After 90 days of consistently tagged campaigns, GHL’s attribution report shows cost per lead, lead-to-client conversion rate, average deal value, and revenue generated per dollar spent by channel. Agencies that implement proper attribution reporting shift budget toward their most profitable channels and generate 23 percent better marketing ROI within six months of implementation without increasing total spend.
Client-Facing Reports That Drive Retention
Agencies delivering structured monthly client reports retain clients at 61 percent higher rates than those providing vague updates. The most effective client report structure includes six elements: new leads generated this month versus prior month with percentage change and the top three performing sources; appointments booked through automated versus manual processes to demonstrate automation value; pipeline movement showing deals advanced by stage and total revenue won; automation performance summary quantifying what happened automatically — follow-up messages sent, reminders delivered, reviews requested, leads scored; Google reputation summary showing current rating, total review count, and new reviews this month compared to last; and three specific data-driven recommendations for the coming month with projected impact. Export GHL dashboard data as a PDF or connect GHL’s reporting API to a branded Google Looker Studio template with your agency logo and color scheme. The format matters less than the consistency — clients who receive the same structured report every month on the same date retain far longer than those receiving irregular updates. GHL Nexa builds complete reporting dashboards and delivers monthly performance reports for agencies and their clients. Book a free consultation to see our reporting framework in action.
Pro Tips From GHL Nexa Experts
Build a weekly dashboard review ritual for your entire team. Every Monday morning, the first 20 minutes should be spent reviewing the primary dashboard as a team. Each metric that moved significantly — up or down — should prompt a single question: what changed? Rising no-show rates might indicate a failed reminder automation. Dropping email open rates might indicate a deliverability issue that needs immediate investigation. Consistent weekly review transforms dashboards from informational displays into operational management tools.
Automate your client reporting delivery. Schedule a monthly GHL workflow that triggers on the first business day of each month, pulls a dashboard summary, and sends a formatted report email to the client. While fully automated client reports are not as personalized as manually crafted ones, the consistency of delivery — arriving in the client’s inbox on the same date every month — builds trust and demonstrates professionalism even if you are managing 30 or more client accounts simultaneously.
Connect GHL’s reporting data to a Google Looker Studio dashboard using the GHL reporting API. This allows you to build a fully branded client reporting portal — with your agency’s logo, colors, and domain — where clients can log in and view their live dashboard at any time rather than waiting for a monthly email. Clients with live dashboard access call their account manager with specific data-driven questions rather than vague concerns, leading to more productive conversations and stronger relationships.
For a free reporting dashboard audit and custom setup consultation, GHL Nexa has implemented GoHighLevel systems for over 400 businesses across 40 countries. Book a free strategy call to discuss your specific setup and get a custom implementation plan.